Illustrative output. The real run happens in your notebook.
Default output
Before: default matplotlib. Red-green palette, no units, gridlines, boxed legend, title inside the figure, 10 pt type on a 6.4 in canvas.
figure2.pdf
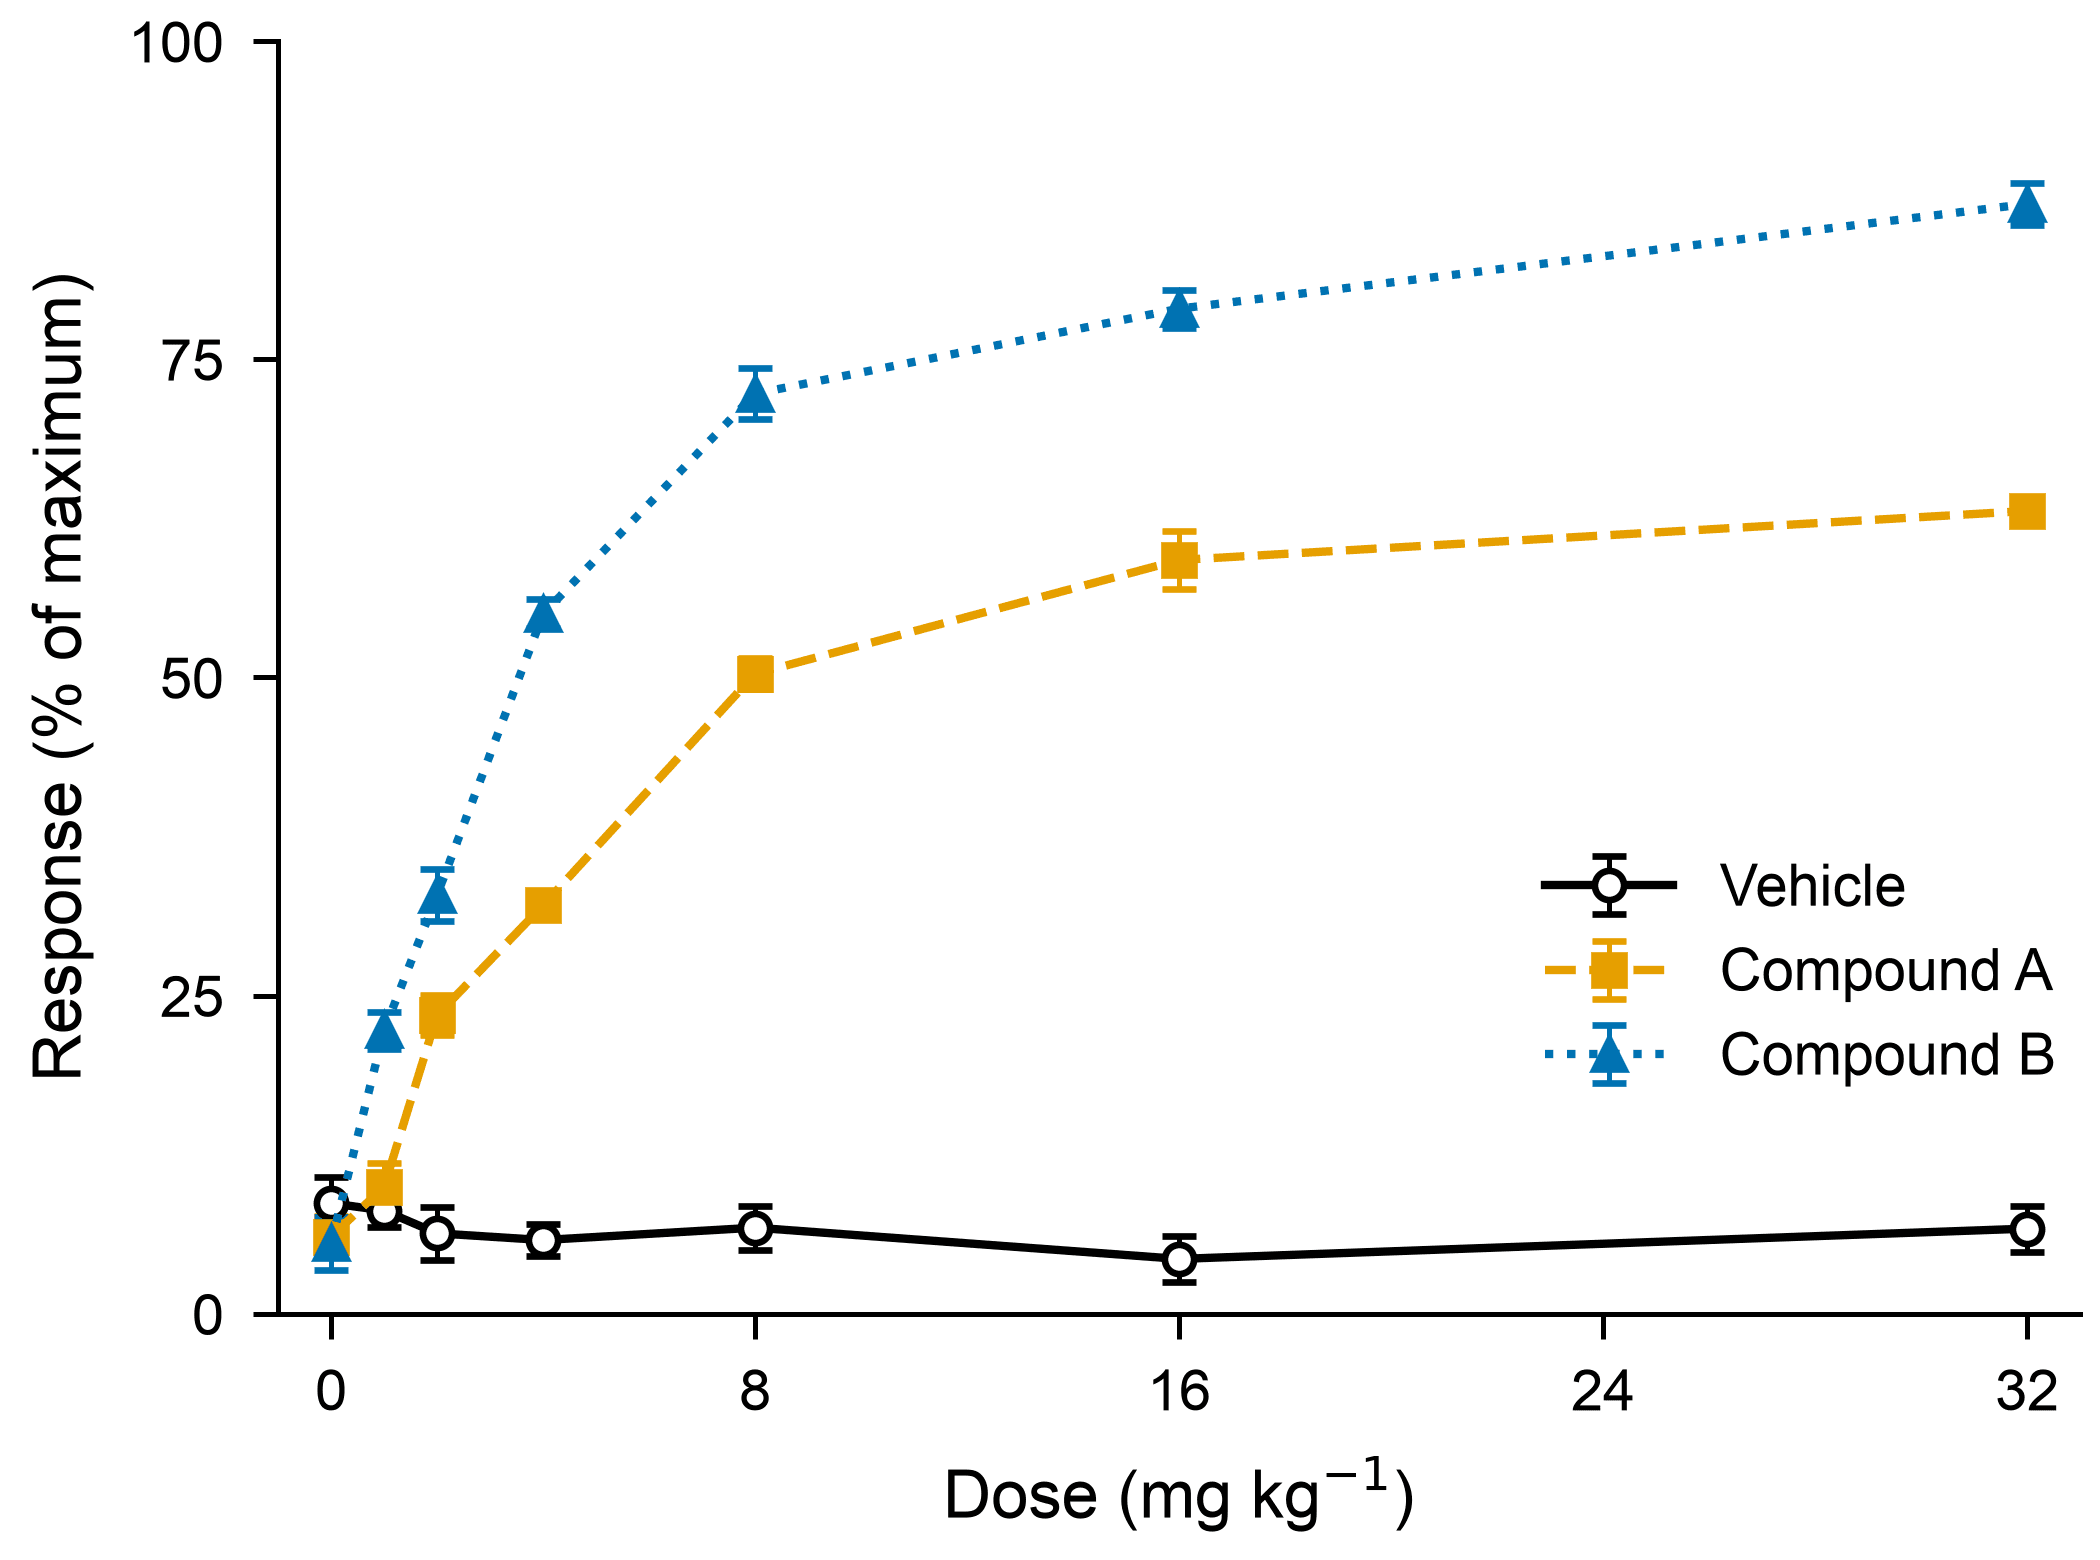
After: same data in publication mode. 3.5 in single column, 8 pt Arial, Okabe-Ito palette with distinct markers, error bars, units on both axes, no top or right spines.
The export checklist that travels with the figure.
Description
Agents can draw a chart in one call. The hard part is drawing the right chart, styled consistently, at the size and resolution a journal, a slide deck or a dashboard actually needs. This skill carries those rules so the agent does not reinvent them each time.
It includes a publication mode: figure widths matched to single or double column, font sizes that survive shrinking, colorblind-safe palettes, vector export, and a caption checklist. In Jupyter the figure is regenerated from the cell, so it always matches the current data.
Chooses the chart type from the question and the data shape, and says why
Applies a consistent style: fonts, tick density, gridlines, legends
Presentation mode: large type, high contrast, one message per chart
Exports PNG, SVG and PDF together with the code that produced them
Writes a draft caption that states what the reader should see
Editor's Recommendation
Recommended by
Runcell team
Why we built this skill
The idea came from a manuscript that was returned for figure sizing, twice. Publication mode encodes the boring rules, column widths, minimum font sizes, vector export, so the figure is right the first time. Because it runs in a notebook, the figure is regenerated from the cell whenever the data changes.
”
What you get
Figures as PNG, SVG or PDF
A reusable style file: matplotlib rcParams or a seaborn theme
The plotting code in a cell you can rerun
A caption draft and an export checklist
Use it when
Figures for a manuscript, thesis or poster
Turning exploratory plots into a consistent set for a report
Anyone tired of fixing font sizes after export
FAQ
What does a dataviz skill for Claude Code do?
It gives the agent rules for making charts well: which chart fits the data, how to style it consistently, and how to export it at the right size and resolution. Claude Code can call matplotlib without a skill, but the results vary from run to run. The skill makes them consistent.
Can it produce figures that meet journal requirements?
That is the point of publication mode. Journals specify column widths, minimum font size, resolution and file type. The skill encodes common defaults, for example 3.5 inches for a single column, 7 inches for double, 300 dpi, and vector output where accepted, and you can set a specific journal's numbers. Always check the final submission guidelines yourself.
Which libraries does it use?
matplotlib and seaborn by default, plotly when you need interactivity. The style rules are library-independent, so the same skill works whichever one you choose.
Does it help with colorblind-safe colors?
Yes. It defaults to palettes that remain distinguishable under common color vision deficiencies and avoids red-green contrasts for categorical data.
 Runcell team